All charts on this page are free to download and free to use. For the charts on other links please ask anyone before you might use them.
I will have – hopefully – more senior friendly charts for all us aging dinosaurs on pages that are standard computer page for printing at home. And easy blogs for understanding each type of DNA test as simple 101 instructions. Shorter and clearer and big print very soon!
In-between see all the tests explained in previous blogs in the contents list, on the right if on a computer – and maybe below if on a phone or tablet.
Below – some of the ideas for new charts as I have gotten them drafted in the last few months, but they are in need of their own page and explanation

The chart gives an idea of how DNA is shared but is not meant to be scientific. It couldn’t be because everyone is different. Even siblings share differing amounts of their grandparents. I add to this note to make sure to explain the concept of the chart. The dots represent the idea of random inheritance and not actuality. In addition this illustrates that autosomal DNA testing comes from across a large swath of your ancestry – but it is random, past your parents. Compared to y-DNA testing or mt-DNA testing which are limited to a specific narrow chromosomal line the autosomal testing, although limited in generations gives an expanded look at one’s genetic ancestry. None of the printed “charts” (and there are many representations) showing random inheritance can portray each individual’s inheritance – it varies from person to person and also does for sibling to sibling. All the charts give you the idea that you will not inherit from every ancestor – you miss many of them from the past and more the farther back you go in time until there is none to be read in the current testing that can currently be used for relative matching. We are all 50% of our parents but from the grandparents back, it is all bets off and you will randomly inherit from random ancestors. Two siblings can also inherit differently from their ancestors. This is why in chromosome painting you can use three siblings (the best number is three) and make a “picture” of the chromosomes of your ancestors.
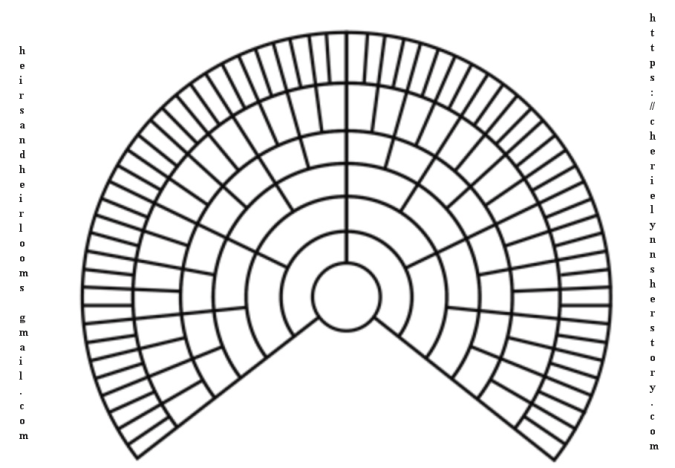
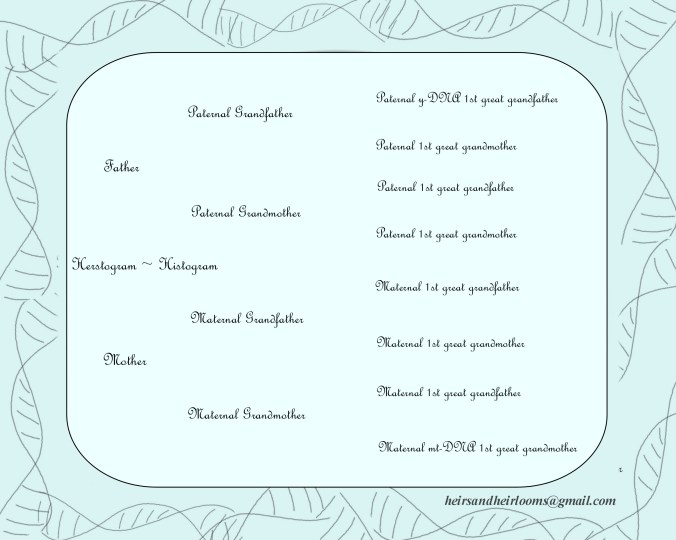
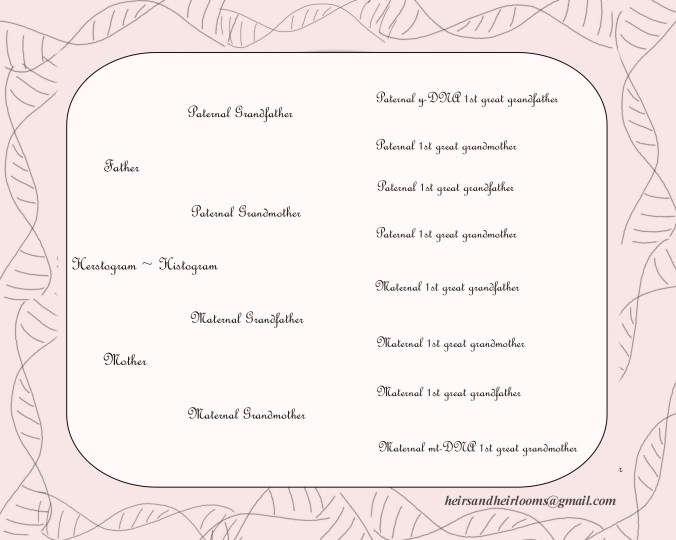
I had this chart made at Vistaprint. I am not sure it helps that much, but I had hoped with one less generation it might be a wee bit easier to read fartherin size for seniors.
See also the blogs and information about tracing the DNA on the X Chromosome – this is not!! 🙂 mt-DNA – so very careful in thinking.
But here are the charts – one for males and one for females. The girls chart has the pink center circle and the boys has the blue center circle. You really must print these out in color to work them and I always fill in mine using a pencil so I can correct mistakes. This is the easiest exercise to have mistakes so check it multiple times –


Fun ancestor charts


This chart loosely illustrates the three main types of DNA tests.
The collection of charts from the experts:
You =of course cannot beat Cyndi’s List for finding everything – more than i could dream of.
https://www.cyndislist.com/us/

Pingback: “Spread The Love Around…” ~ It Is The Stuff That Makes The World Go Round – DNA | Cherie Lynn's Herstory
Pingback: “Search This Group” ~ How Tos For Facebook | Cherie Lynn's Herstory